

IQ Liquidation Heatmap is a powerful indicator that maps out key price zones where liquidation cascades are likely to occur. Whether it’s clustered stop-losses or over-leveraged positions, this tool identifies where the market could experience sudden, high-volatility moves—both historically and in real time.
By highlighting both current and past liquidation zones, the heatmap gives you a data-driven advantage: see where the market has broken before, and where it’s about to break next.
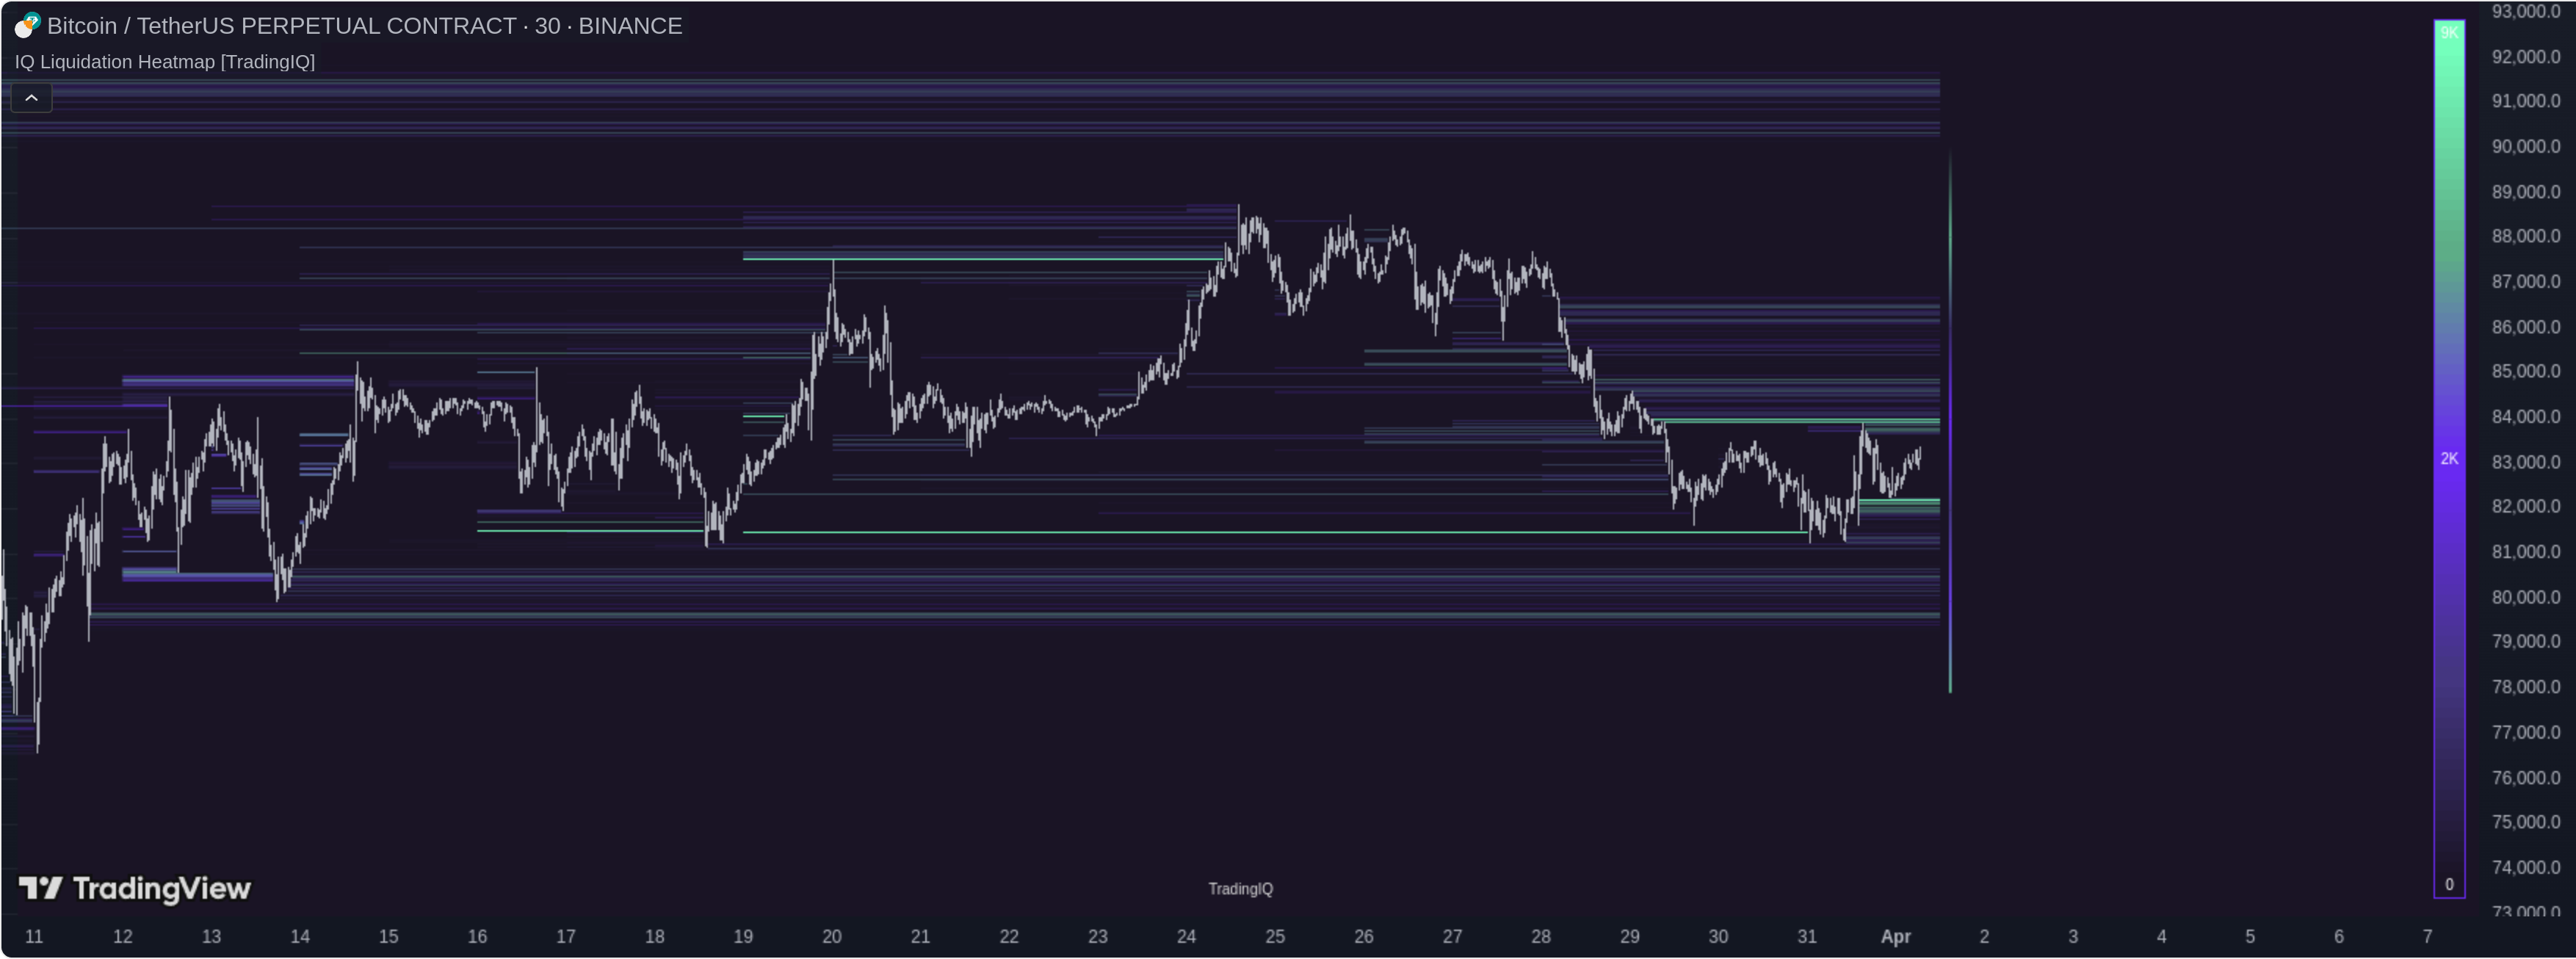
🔹 Live & Historical Liquidation Zones – Understand both past pain points and future danger zones
🔹 Upside & Downside Cascades Visualized – Know where a short or long squeeze is about to trigger
🔹 Color-Coded Clarity – Bright green = danger (high liquidation risk), purple = calm (low risk)
🔹 Heatmap + Cluster Bars – View liquidation concentration across full price regions
🔹 Simple Yet Powerful – No setup needed. Just add it to your chart and trade with the data.
Secure IQ Liquidation Heatmap – 100% Free During Your Trial

You can unlock full access to IQ Liquidation Heatmap today – completely free. Start your 14-day trial now and activate the heatmap directly on TradingView!